Interpretation of the AID-HS results
This guideline explains how to interpret the AID-HS pipeline results : Individual and interpretable patients reports
Here is a video tutorial on how to interpret the AID-HS results: Interpretation tutorial.
Interpreting the AID-HS report
The AID-HS pdf report and .png images of the pipeline results are saved in the folder:
/output/predictions_reports/<subject_id>
HippUnfold’s segmentation and surface reconstruction
The first page of the report provides a visualisation of the hippocampal segmentation and hippocampal pial surfaces reconstructed with HippUnfold. It also provides dice scores measuring the similarity of the hippocampal segmentation with the template atlas used by HippUnfold.
Note: We recommend to visually inspected segmentation with a score below 0.7 to check whether the segmentation has failed
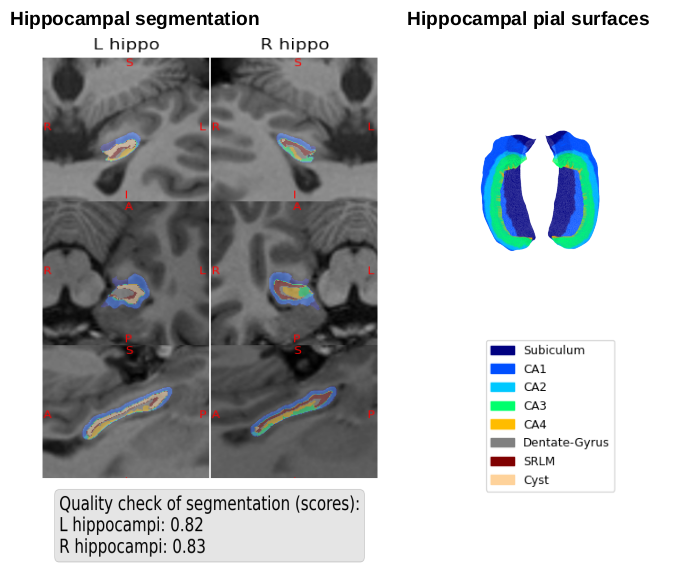
HippUnfold results are stored in the folder: /output/hippunfold_outputs/hippunfold/<subject_id>
Hippocampal segmentations are saved under
anat/<subject_id>_hemi-<L/R>_space-cropT1w_desc-preproc_T1w.nii.gzHippocampal pial surfaces are saved under
surf/<subject_id>_hemi-<L/R>_space-T1w_den-0p5mm_label-hipp_midthickness.surf.gii
You can uses Workbench Connectom to visualise hippocampal surfaces and segmentation.
Normative growth charts
The second page of the reports present the individual hippocampal features compared to the normative trajectories of healthy population.
Note: The growth curves have been computed with data that were harmonised to adjust for between-scanner difference. If you have not harmonised your patient data, the comparison is unreliable as scanner differences might be shifting the features outside the normal range.
The growth curves are given for five hippocampal features: volume, thickness, density of gyrification, mean curvature and intrinsic curvature. The patient’s left hippocampus (blue) and right hippocampus (pink) are plotted against the normatives curves (25th – 75th percentiles in dark green, 5th – 25th and 75th – 95th percentiles in light green).
The individual shows clear features of HS if one or both hippocampus exhibit at least three of the following:
the volume is lower than the 5th percentile of the population
the thickness is lower than the 5th percentile of the population
the gyrification is lower than the 5th percentile of the population
the mean curvature is higher than the 95th percentile of the population
the intrinsic curvature is higher than the 95th percentile of the population
The pink box provides an interpretation of the results.
If your data are not harmonised, the box will mentioned that the growth curves might not be reliable and should not be interpreted
If your data are harmonised, it will detail the number of features per hippocampus that are exhibiting clear features of hippocampal sclerosis. If both hippocampi exhibit above 3 features consistent with HS, the box will mention that this could be a bilateral HS.
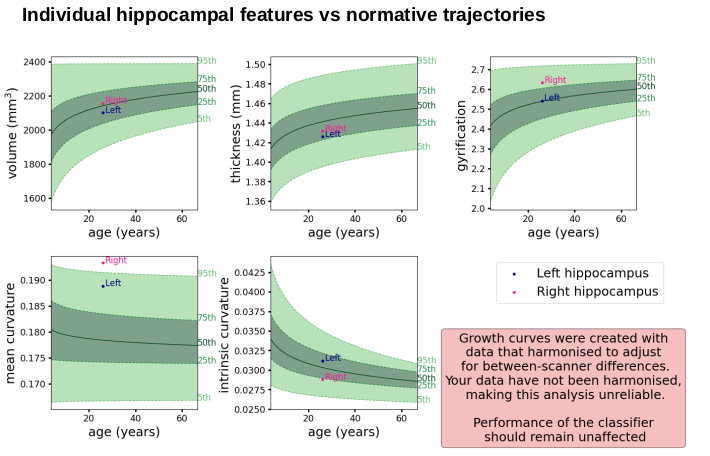
In the example above, the data for this patient were not harmonised, therefore the growth curves should not be interpreted. However, if they were interpreted, we could say that most of the features are in the normal range of the healthy population and that no hippocampi exhibit clear features of hippocampal sclerosis.
Asymmetries and detection & lateralisation scores
The second page also shows:
The magnitude and direction of the asymmetry features against left and right abnormality thresholds.
The automated lateralization scores from the AID-HS classifier, indicating the probability that hippocampal feature asymmetries are consistent with left (blue) or right (pink) HS or that there is no asymmetry (green). The prediction scores are also saved in a csv file in
aidhs_data_folder/output/predictions_reports/<subject_id>
Note: A high score for “no asymmetry” do not always means that there is no HS. If both hippocampi exhibit clear features of HS, it could mean that the individual has a bilateral HS.
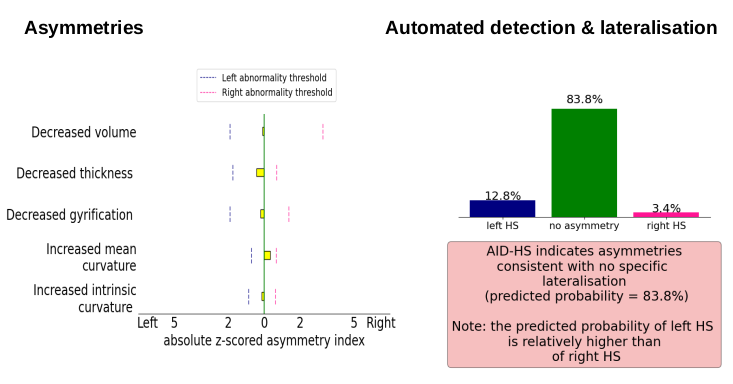
In the example above the magnitude of the asymmetries are all below the thresholds and the direction of abnormalities is not consitent with right or left HS. Based on these asymmetries, the automated classifier predicted with 83.8 probability that there is no asymmetry between the hippocampi.
Limitations
Limitations to be aware of:
If there is a segmentation or reconstruction error the results of the AID-HS might not be reliable
If you have not harmonised your data, the analysis of the individual hippocampal features against the normative trajectories might not be reliable.
The AID-HS classifier has only been trained on unilateral HS patients and we do not have data on its ability to predict bilateral HS. However, the characterisation of hippocampal morphology can provide supporting evidence of bilateral HS.
The AID-HS classifier have been trained on 3D T1w scans acquired at 3T. Results on other magnetic field strenght have not been evaluated.